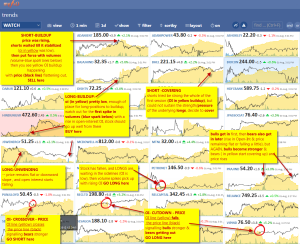
a picture is worth a 1000 words
all that you would like to know on how to use price- oi- volume data in a nutshell :
click to zoom image –>

its been 2 years since we’ve published this image! and we’ve seen this funda work so well especially in intraday :)
